This assignment asked students to create maps that illustrated how their experiences of the city had changed since the pandemic. They could focus on their block, on their neighborhood, on the routes they used to get around the city, on how they procured their necessities such as groceries or medications, or on any other topic that connected them to the spaces outside of their homes. I asked students to think about how their perceptions and experiences of the urban landscapes had changed and had possibly become more constricted under the conditions imposed by the pandemic. Our inspiration for this assignment was this project by Bloomberg CityLab. Below you can see their maps, along with excerpts from their papers describing what they drew.

“The first location that I drew on my map was my house, symbolized by an artistic rendition of my front porch. I made this the focal point of the map because this is where I spend most of my time these days. On the porch, I drew my porch furniture, my roommate’s cat, Lauren, my laptop, my guitar, an aloe plant, and a Black Lives Matter sign. These are all symbols of hobbies, interests, and causes that I have become more acutely aware of since the pandemic. I also noticed that the frequency of leisure activities that I participate in per week has not changed despite my limited landscape. The number has stayed the same or maybe even grown since the start of the pandemic due to perceived boredom. The next location that I drew was a glimpse of the park, the American Legion Lawn, which is across the street from the main entrance of the Indianapolis Public Library off of St Clair Street. This location is significant to me because for over three years I have been working with various community members to develop and maintain mutual aid networks throughout the city. Much of this outreach was a result of food insecurity within the homeless people that live downtown. Since it is located across the street from the city’s largest public library, the park has been a primary location for meeting with all kinds of people throughout our networks and sharing aid and resources.”
“
There are several things I learned about myself as a complete this city map. Firstly, I chose to not include people on my map because I have become a more solitary person as a result of the pandemic. Before the pandemic, large social gatherings are where I thrived. I think the prospect of that changing, possibly for a longer time than we imagine, is a bit terrifying. Secondly, I have found that a fear of catching or spreading COVID-19 has kept me inside most days. Although I do venture out more nowadays and even more frequently as vaccines roll out, at the beginning of the pandemic, I traveled largely for necessity only. This pretty much meant only going to the grocery store. It made me realize how much I miss wandering around and exploring my city.”
“For my map project I decided to show what many of my Fridays looked like during the summer in the pandemic as my experience with the city was most different then, even compared to now. To begin, my map starts at my house and then leads to the Boys and Girls Club of Indianapolis where I worked 8:30am to 4:30pm Mondays through Fridays during the summer. It only takes around 10 minutes to get to the Club and though my route stayed the same even with the presence of COVID-19, I did notice seeing more panhandlers on the median and sides of the road heading towards the Club. I think that the financial impacts of COVID with unemployment could have been responsible for the influx of people panhandling as it put people out of jobs or reduced hours. The part of the city the Boys and Girls Club is in has a handful of abandoned and closed businesses and the most traffic of people you see at any of the businesses are people at the used car lots. However, more businesses seemed closed from the outside than usual as well.”
“In the evening, a few of my friends and I would sometimes go to the bar Kilroy’s in Broad Ripple. Kilroy’s was one of the only bars in that area that was still open during the pandemic. However, there was no standing, walking around, or dancing allowed inside like there would usually be. Instead, they extended their outdoor seating to the parking lot and we enjoyed the change and was happy to take advantage of the nice weather and open area. Broad Ripple Avenue itself was closed to traffic but open to pedestrians. This enabled people to walk around and line the formerly high trafficked road. Some people came with a mic and played music, others came with their dogs, and some would come just to walk around. Since the bars closed at 12 this also offered an area of space for people to continue their night. I am not sure if they will close it again in the future, but I am glad I got to experience it while it was.”
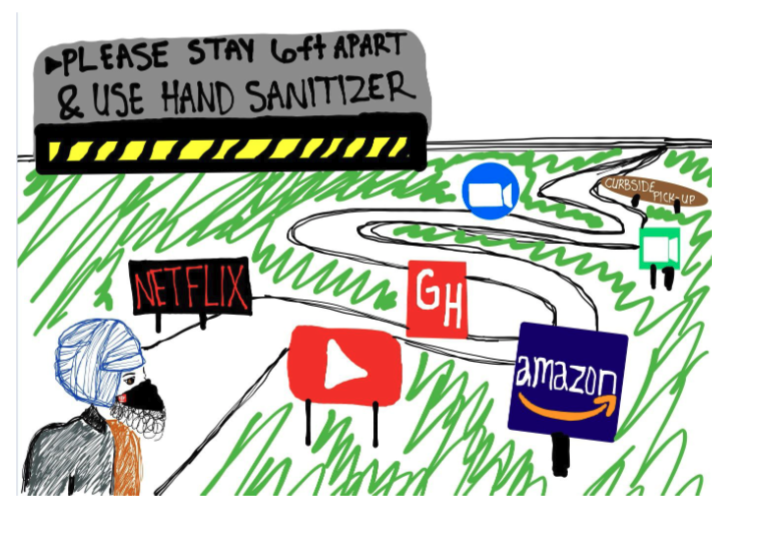
“To start, the major change that occurred within the pandemic is the physical distancing protocol and the urge to stay home and refrain from social interactions in-person. Because of this, most interactions I had with my friends and loved ones were over FaceTime or a phone call, although this was a major change in life, a bigger abnormality came when all my work calls and college courses were moved to Zoom video calling as well. Not only did this prohibit certain aspects of learning for me and my for me and my peers, but it also meant whenever I was working for my job, help was only received through our monthly video calls or emails which I rarely received back in a timely manner—as opposed to walking across the office to receive clear assistance on tasks at hand.
“Another big change that occurred is the way in which I now got food, groceries, and other commodities. Pre-pandemic, my weekly routes always included stopping to get gas, groceries, and medication at least once a week. But with the shortage of stock and rising number of cases in my county, not only was it safe to continually go shopping every week, but it was hard to get the essentials/what was needed. This, in turn, led to the use of buying mostly online via Amazon and using services that would collect all your groceries for you and leave them at your doorstep.”
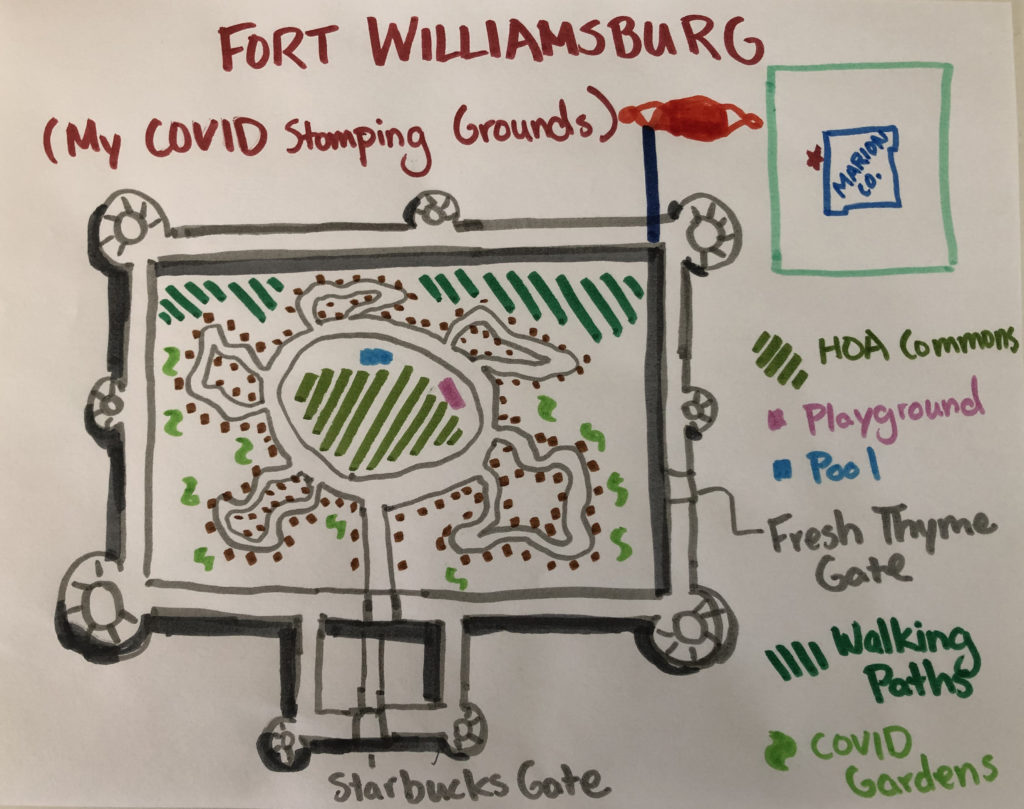
“This map is a fictionalized version of my suburban cul-de-sac, Williamsburg Villages. While Fort Williamsburg does not actually exist, many of the elements inside it do, as I will detail below. It was inspired by the idea that since the mid-twentieth century, many white Americans with sufficient means retreated to the suburbs and pulled up a drawbridge behind them. The New Deal Federal Housing Administration’s redlining and discriminatory mortgage programs (existing well beyond the 1968 Fair Housing Act) prevented Black people from following until the drawbridge was firmly in place. I now find myself in the ranks of white flight-ers, having moved to this neighborhood from a more urban home in March 2020, at the very beginning of COVID shutdowns.”
“In 2020, residents throughout the neighborhood planted an inordinate number of vegetable gardens and bonded (at a distance) through shared food. These gardens have been a source of entertaining homemaking during shutdown and a vehicle for reliable nutrition when grocery store supplies are irregular; furthermore, as Cooked: Survival By Zip Code, pointed out, they serve a cooling function on hot days. The neighborhood is also bordered by a number of walking paths through semi-forested areas.”
“I hope that this map conveys some sense of the inward-looking, isolated nature of suburban life during COVID. When most of our external exposure is online (for those of us lucky enough to have internet access), we have a constant ability to curate our own experiences and, if we so choose, little exposure to people whose experiences are different.”
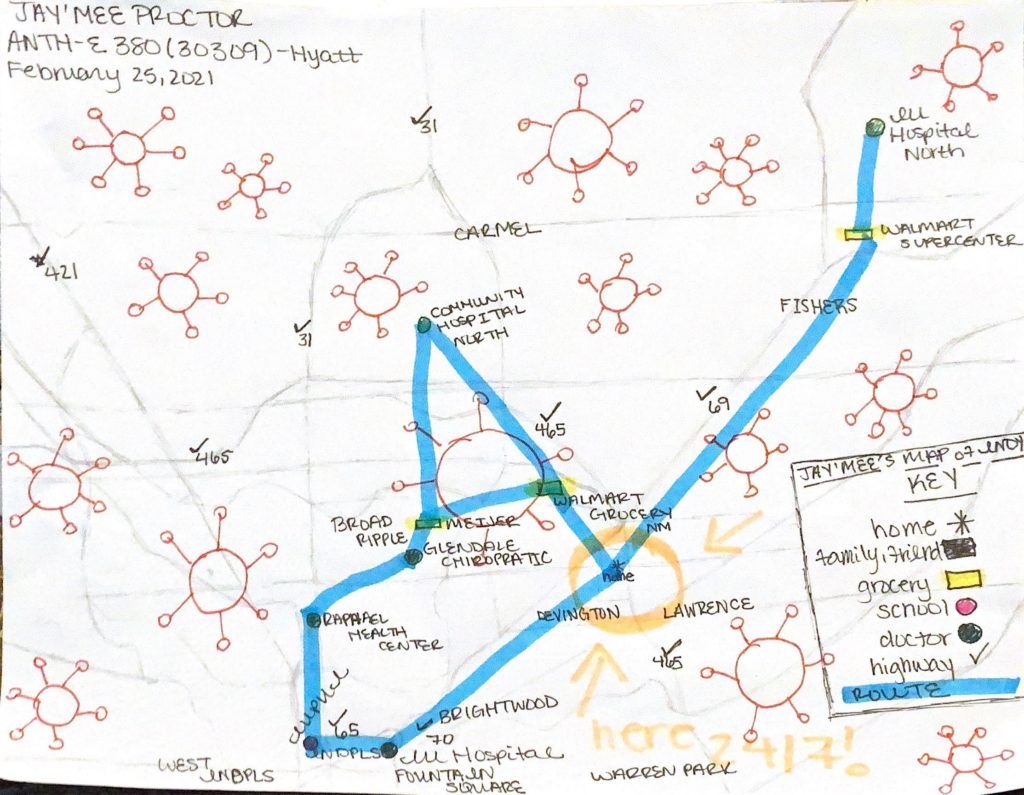
“The COVID-19 pandemic has shaped every aspect of my life, from the overarching daily structure to the smallest details. Prior to the pandemic, I lived a life of routine structure and spontaneous trips. My weekdays were shaped by my school and class schedules, which dictated where I would be and for how long. These schedules remained consistent from week to week, which provided a sense of structure to my day-to-day life.”
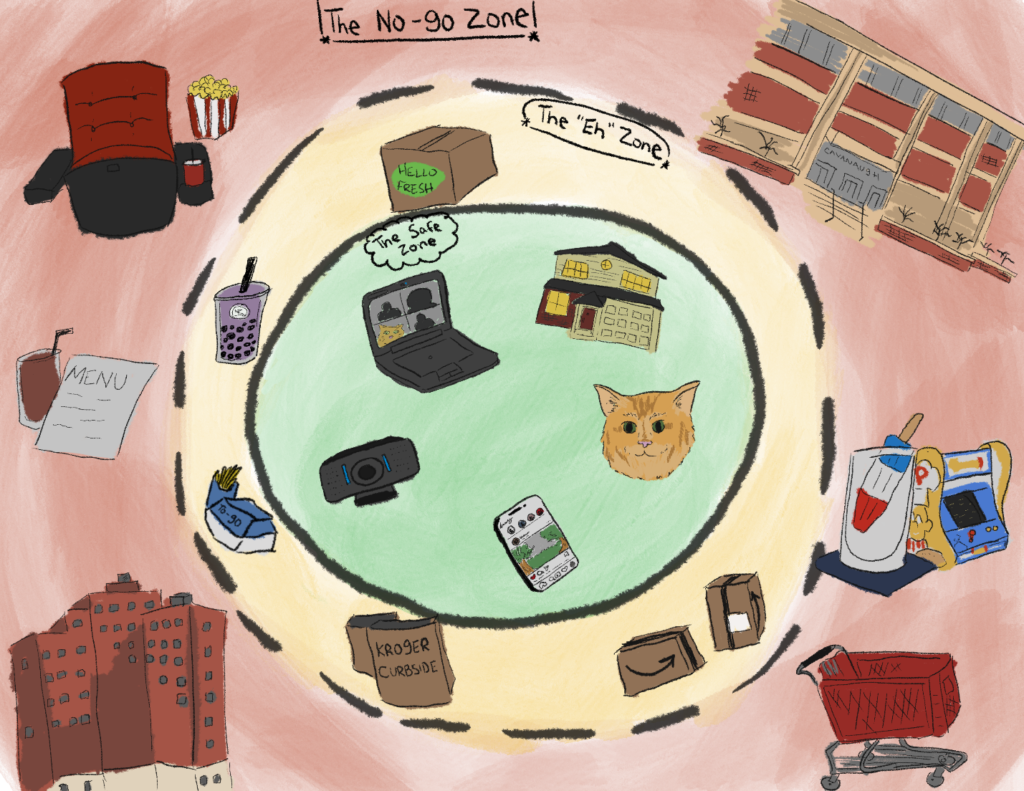
“My COVID map is separated into three regions: the center circle is the “Safe zone,” the middle ring is the “Eh Zone,” and the outermost region is the “No-Go Zone.” The No-Go Zone features the activities and locations no longer available with the current state of the pandemic. […] The “Eh” Zone of my map illustrates my connections to the outside world during the pandemic. My life has predominately taken place inside my home, but I still relied on other services to fulfill my needs. Amazon became my leading source for buying anything related to the home, appliances, video games, and pretty much anything that couldn’t be purchased from a supermarket. While I love to support local businesses, the pandemic has made it difficult to do so because many do not have reliable contactless ordering systems. […] The inner circle of my map, as stated previously, I dubbed the “Safe Zone.” It is important, however, to note that there were times when I didn’t feel safe even within my own home, for fear of improbable exposures through physical objects or mail.”
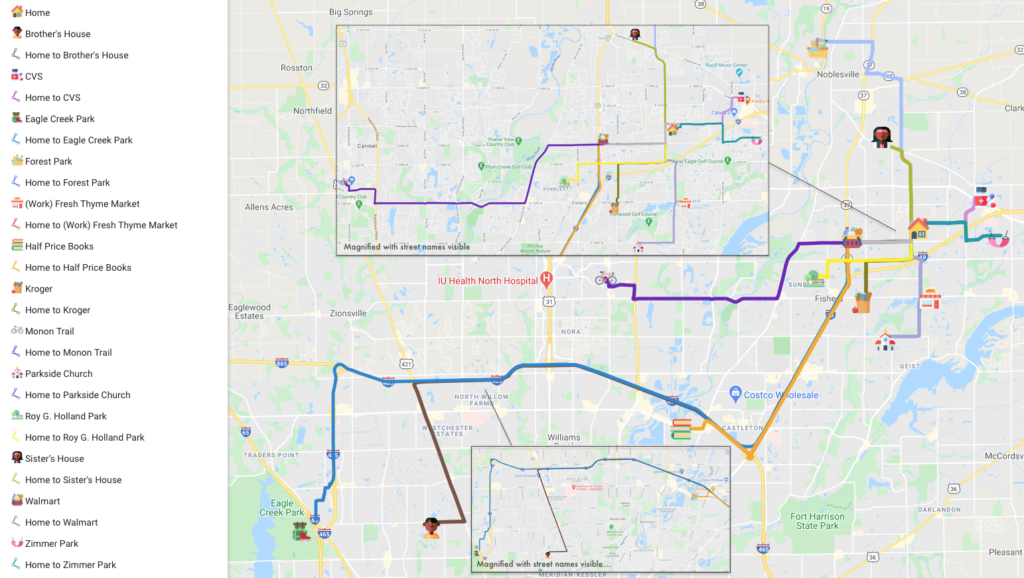
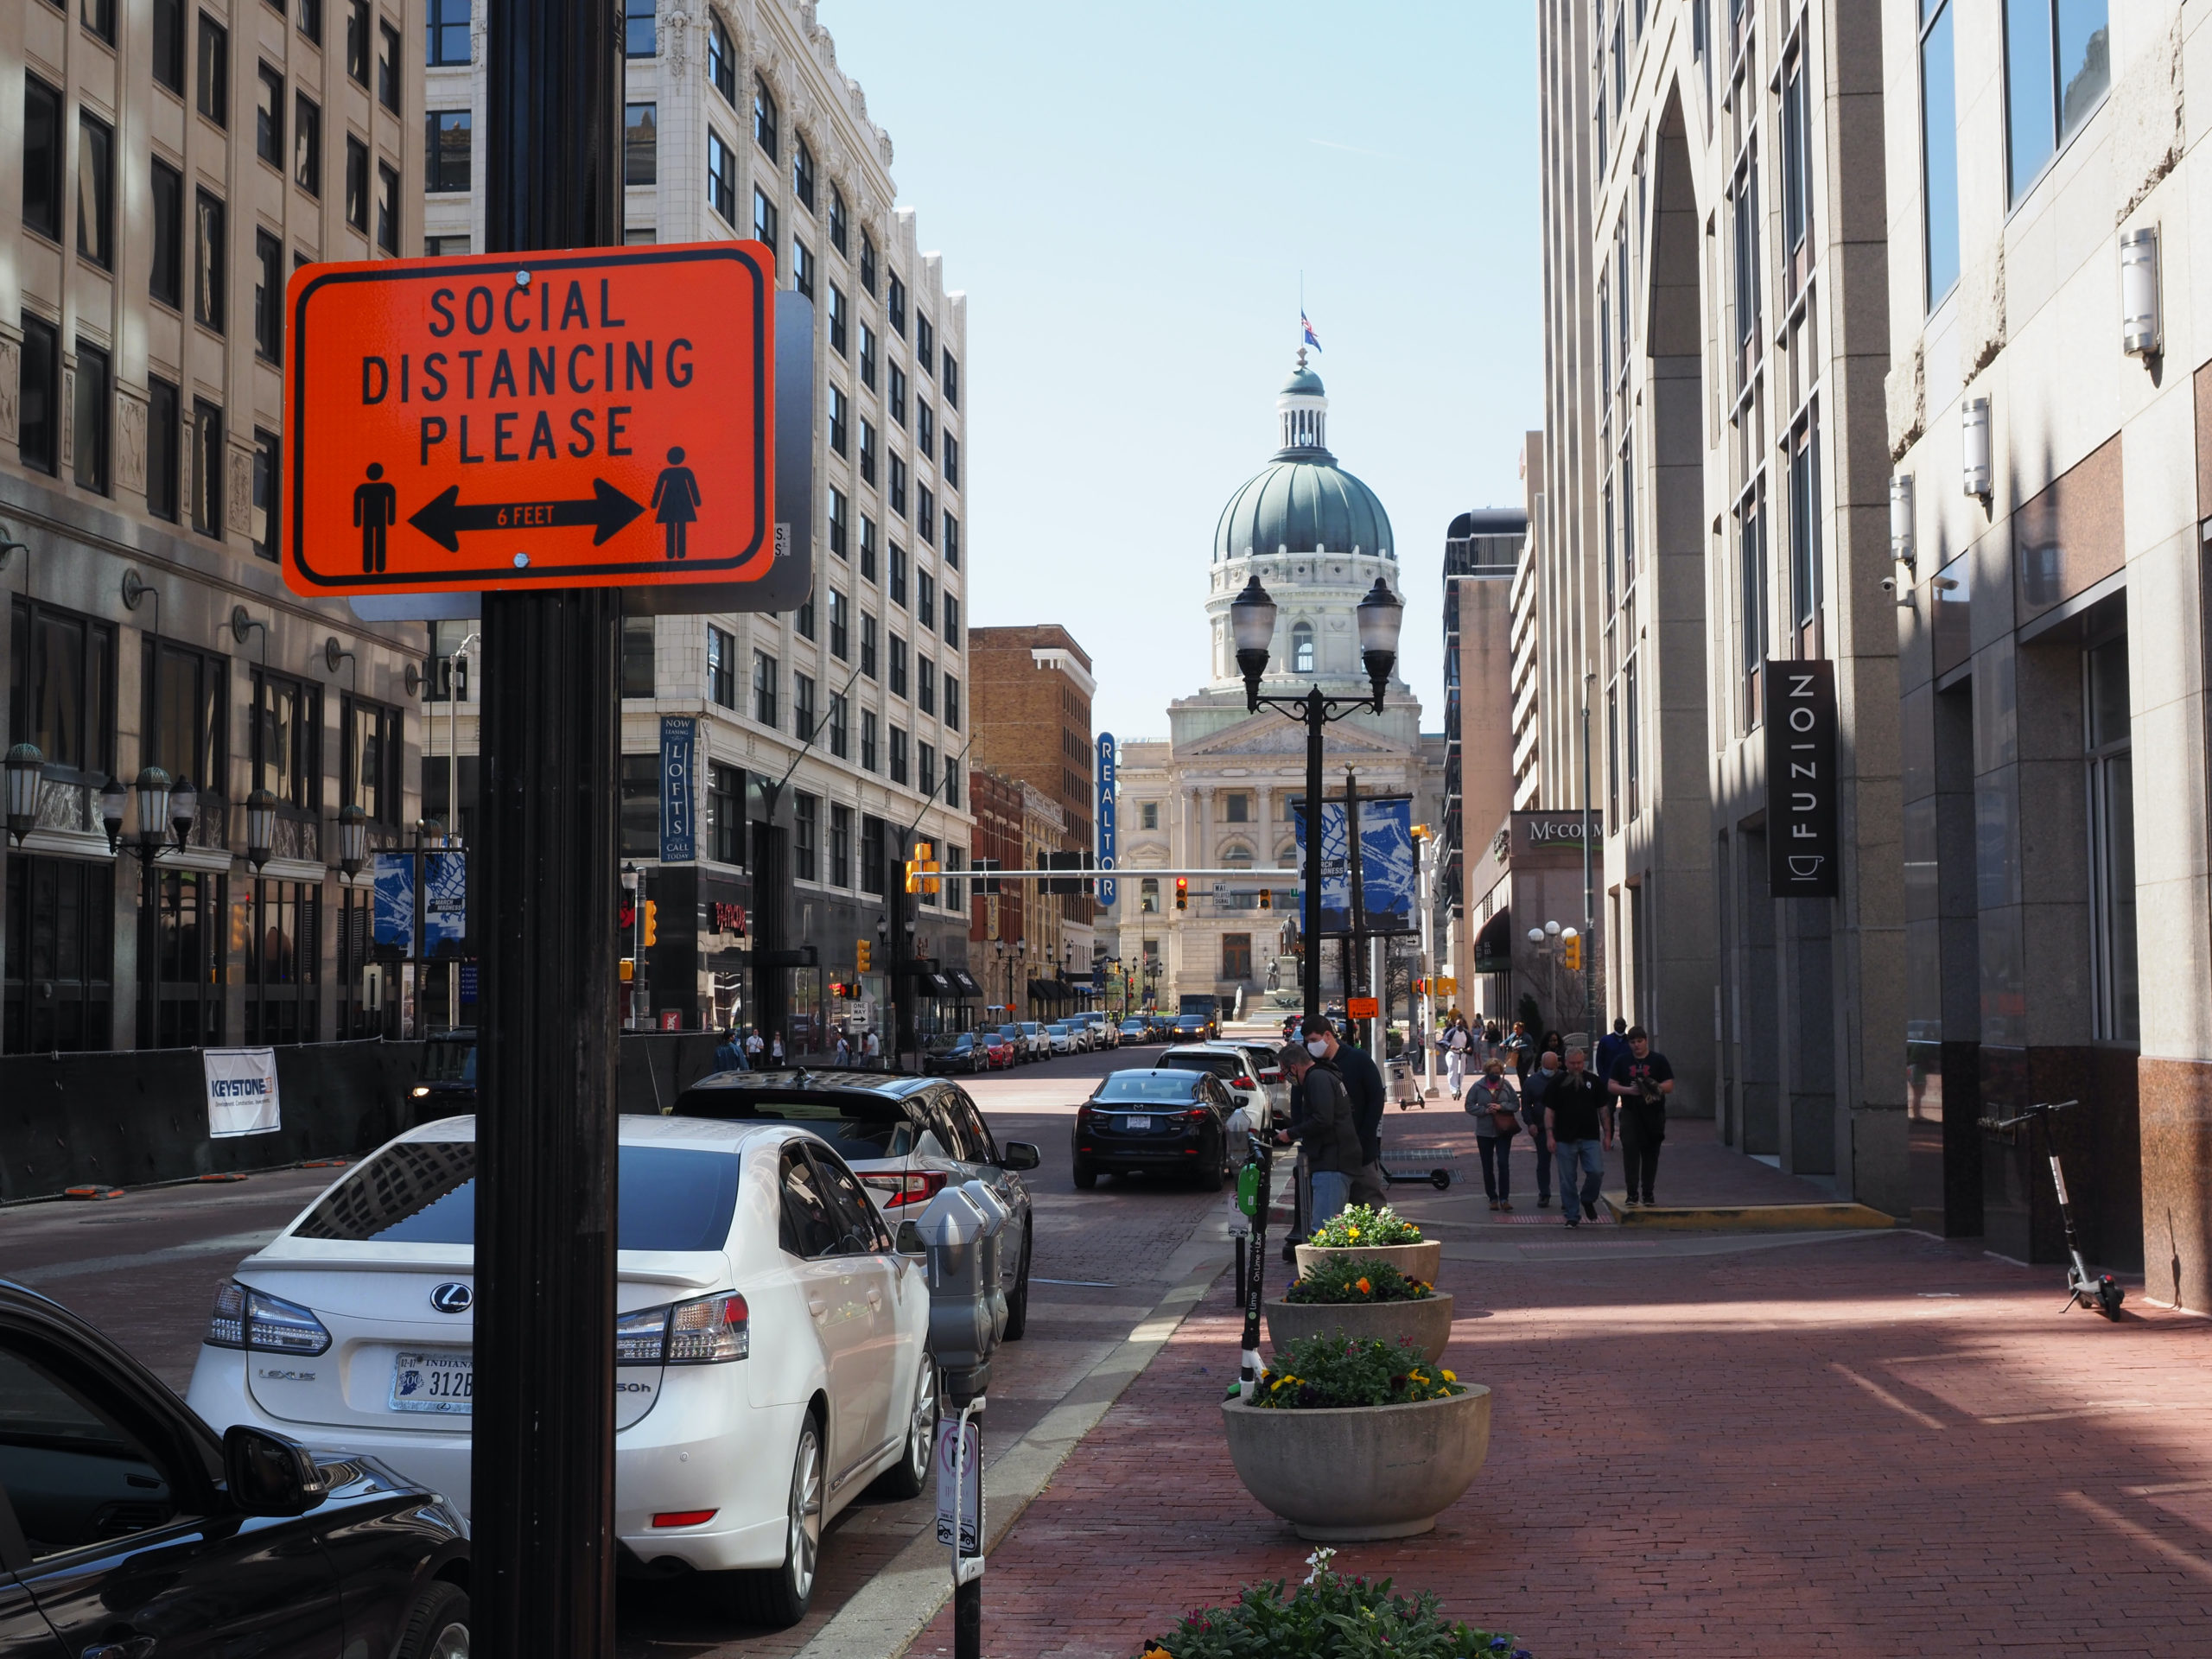
“While we know that COVID-19 has been impacted our domestic lives in different ways, it is important to look externally as well. How have aspects of the pandemic influenced the ways in which we navigate publicly? To explore this, I created a map that displays how I now connect with the spaces outside of my home. I no longer visit certain places or people as often as before and have found new ways of connecting with the city of Indianapolis that also abides by mandates. “
“I chose to categorize the places on this map by three themes: relationships, leisure, and necessities. These have been the most important parts of my life to maintain and tend to throughout the pandemic. With distancing, isolation, and quarantine being recommended over the last year, our ability to connect with people has become more difficult but the need for connection has risen immensely. I can absolutely say this is true for my own life. […] Leisure is the next category that represents a few locations on my map. Although we are in the middle of a pandemic, I believe it is necessary to continue pursuing activities that bring us joy. Acting on our hobbies might look slightly different than it did at the start of 2020, but it is possible. One might say that COVID has given us the time to delve deeper into them and even develop new interests. Unlike before, my favorite place to be is outside now. […] The last category displayed by locations on my COVID-19 map are necessities. These places are where I go to buy groceries, medicine, and obtain other essentials for my personal life and home.”
“From my COVID-19 map, I realized just how much and at the same time, very little has changed within my daily routine of transportation. Before the pandemic, other than school, work, medical, and occasionally visiting friends, I never really did much regarding going outside my home. For the most part, I would describe myself as a homebody with the need to go out and socialize every once and while or to handle business. But after I would go out, it would take me at least a week (sometimes two or more if it were an extensive event/outing that weighed me socially), before I went out again. For basic needs, I always utilized online shopping and delivery services. This includes groceries, clothes, shoes, medicine, etc. Everything was a tap, click, or phone call away on my phone. Therefore, I did not see the need to go out unless it was with family, handing necessary business that required my actual presence or if it was necessary, such as going to class. Therefore, before the pandemic, my mobility was between mostly sedentary and somewhat active, hence why my home is circled bright orange on my map! I mean it when I say I am home 24/7. So based on my map, it looks like the frequency of my transportation stayed the same with just a bit more added.”
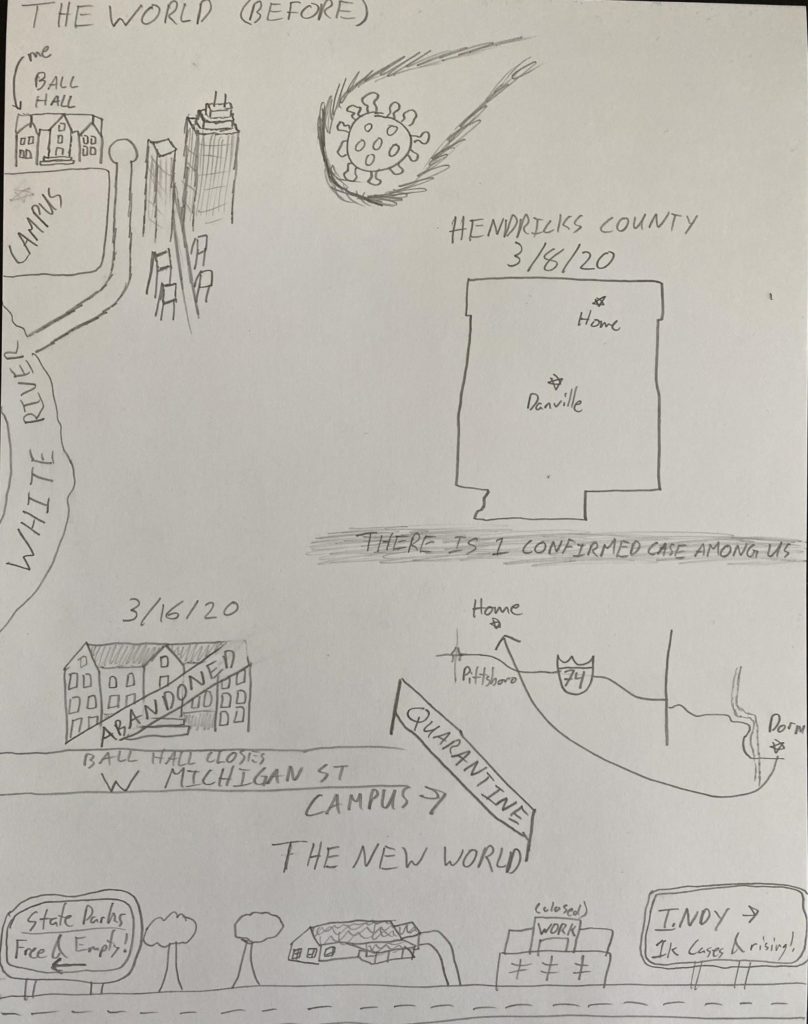
“[M]oving back in with my parents full time was not ideal, and may qualify as a form of torture in some more progressive countries. However, it completely eliminated the city as a place in my life, for about half a year. The way it went from being such an important, common place in my day to day existence to barely even an after thought I think is only comparable to graduating high school and never going back. Shortly after campus became a non-place, work also closed, leaving me with no place to be but home.”
“I’m very grateful for the state’s decision to leave parks open and free. By the time retail had closed down the weather had turned for the better, from frosty winds to bright breezes. I probably went hiking, either alone or with friends, every other day. Classes weren’t organized or redesigned for online learning, so I had all the time in the world to breathe in the fresh air and exercise. The way the forest replaced the city and the suburbs in my daily routine was nothing short of transformative.”
“The effects of this pandemic can be seen throughout the city in the traffic and density of people. For example, many people and places of employment do not need workers to be in office to function. As such there are many empty parking lots all over town. The same applies for schools the hallways feel empty. The only places that seem to still always have traffic are fast food restaurants. Interestingly there has been at least one activity which has had a surge of people doing. Walking outside.”
“Overall, in my experience of the pandemic there has been a significant increase in the amount of people doing things at home. Not just with activities like work or school but also other recreational things. People do not seem to be going out to drink with the friends or going out to eat. Instead, they are sitting at home and finding entertainment there. This leads to more and more people going for walks. This effect is likely different based on the area observed however I believe that this is happening all over the place to different degrees. While the pandemic has been filled with tragedy and sacrifices to everyone. Hopefully, this habit is one which sticks around even after everything returns to normal.”
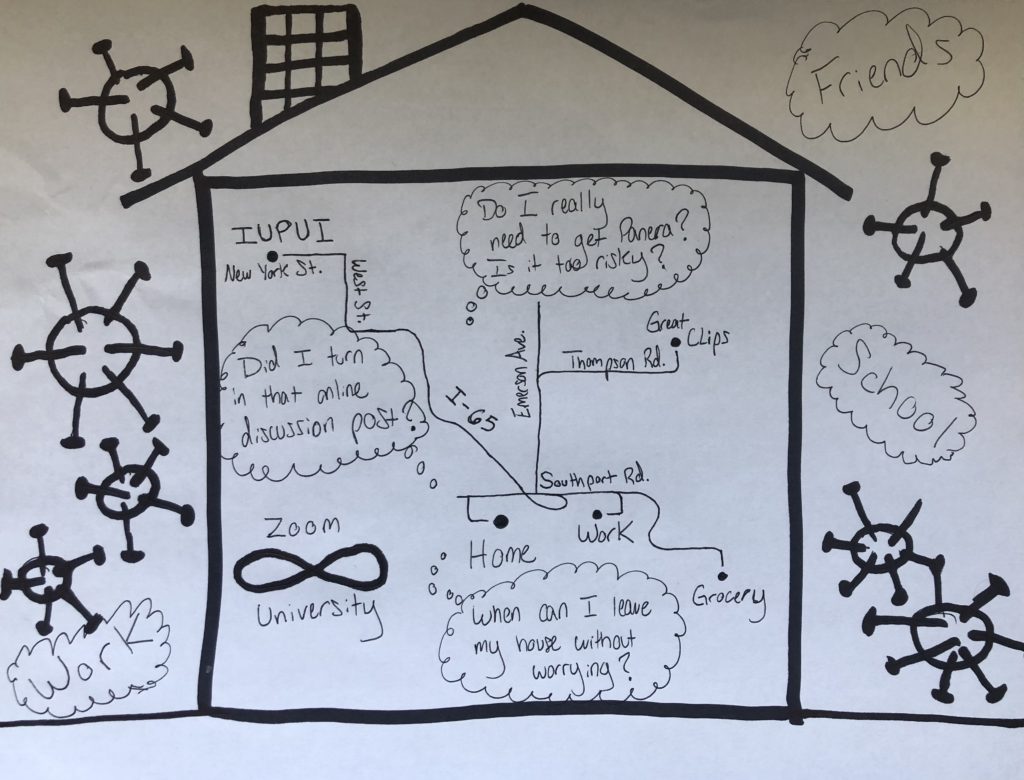
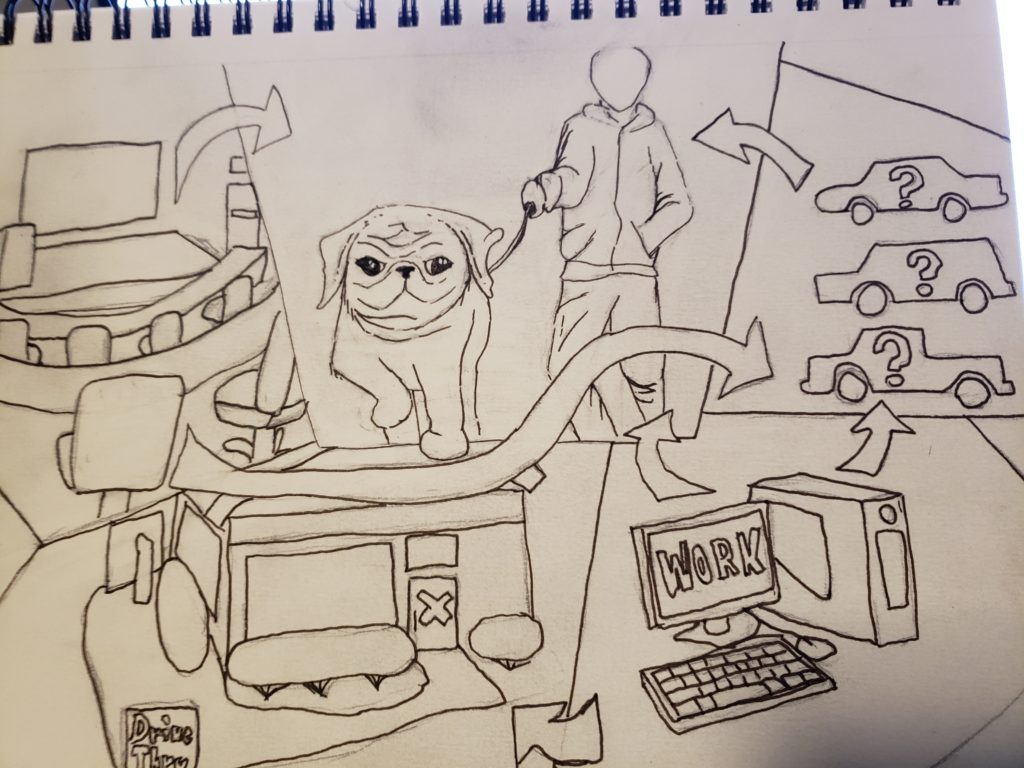
“In my map, I decided to represent how I felt during COVID-19 and the pandemic through a representation of my thoughts, feelings, questions, emotions, and physical surroundings. My understanding of the urban landscape and use of it had changed drastically from the year 2019 to 2020. It is still changing today as I feel more and more adventurous to go out into the world. I am not one who enjoys sitting in the same spot surrounded by the same thing’s day in and day out. In other words, I cannot sit still. This was hard for me during quarantine, and still challenges me to this very day.”
“In my representation of my surroundings, I decided to include a drawing of a house. To show that while I was not literally at my house for the entirety of quarantine, it sure felt like it. The main component of my quarantine was my house. It was where I did homework, attended online zoom meetings for class, met with my friends on zoom, played video games, ate breakfast, lunch, and dinner, slept, worked, etc. It quite literally felt like my house was not only my home, but a prison as well. A prison in a good way, because while there was an overwhelming feeling to escape, the threats on the outside were far too great for that type of aspiration and motivation.”
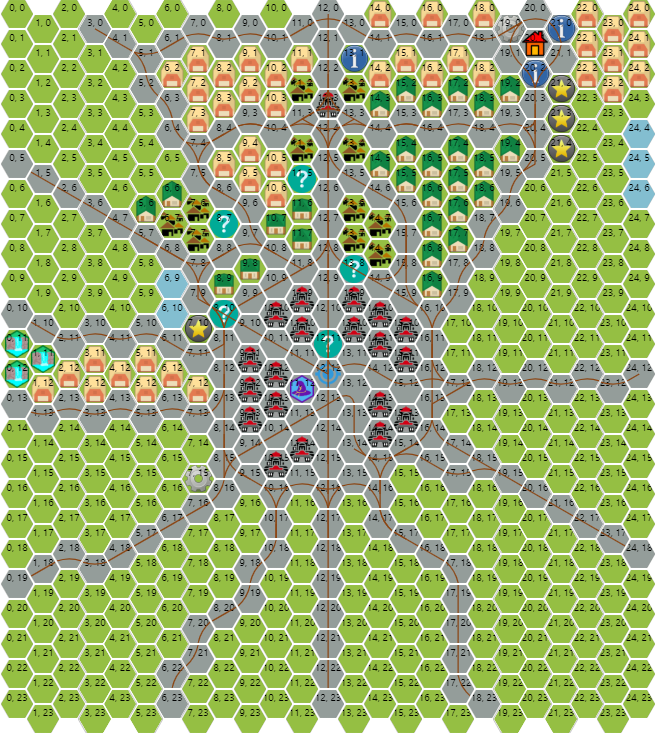
“In 1977 Bob Bledsaw and Bill Owen published a supplement for the Dungeons & Dragons tabletop roleplaying game entitled “The Wilderlands of High Fantasy.” This supplement included a map, which, using hexagonal tiles, depicted a fantasy world which the players and their characters could, over the course of play, adventure through. […] when asked to map my urban experience, a Wilderlands-of-High-Fantasy-style hex-map of Indianapolis seemed like a perfect fit. I have therefore endeavored to present a hex map that not only depicts Indianapolis and the surrounding metropolitan area, but also features places of interest that might create an immersive experience for a D&D player wanting to play as the “Holly Starr from Indianapolis” character.”
“The map’s most prominent feature is the city of Indianapolis and the surrounding metropolitan area, where I have spent a vast majority of quarantine. To provide a simple key, the grey tiles and brown lines (hex 7,5) represent roads and urban areas, the barns represent farmhouses and rural areas (hex 22,1), and both home tiles represent residential areas. The village and city icons (hexes 13,7 & 13,9 respectively) represent urban and suburban areas, and the waterfall areas (hex 0,11 and adjacent) represent natural areas or parks. Finally, the question mark and exclamation mark tiles represent necessities or places of interest (hexes 11,5 & 13,1 respectively).”